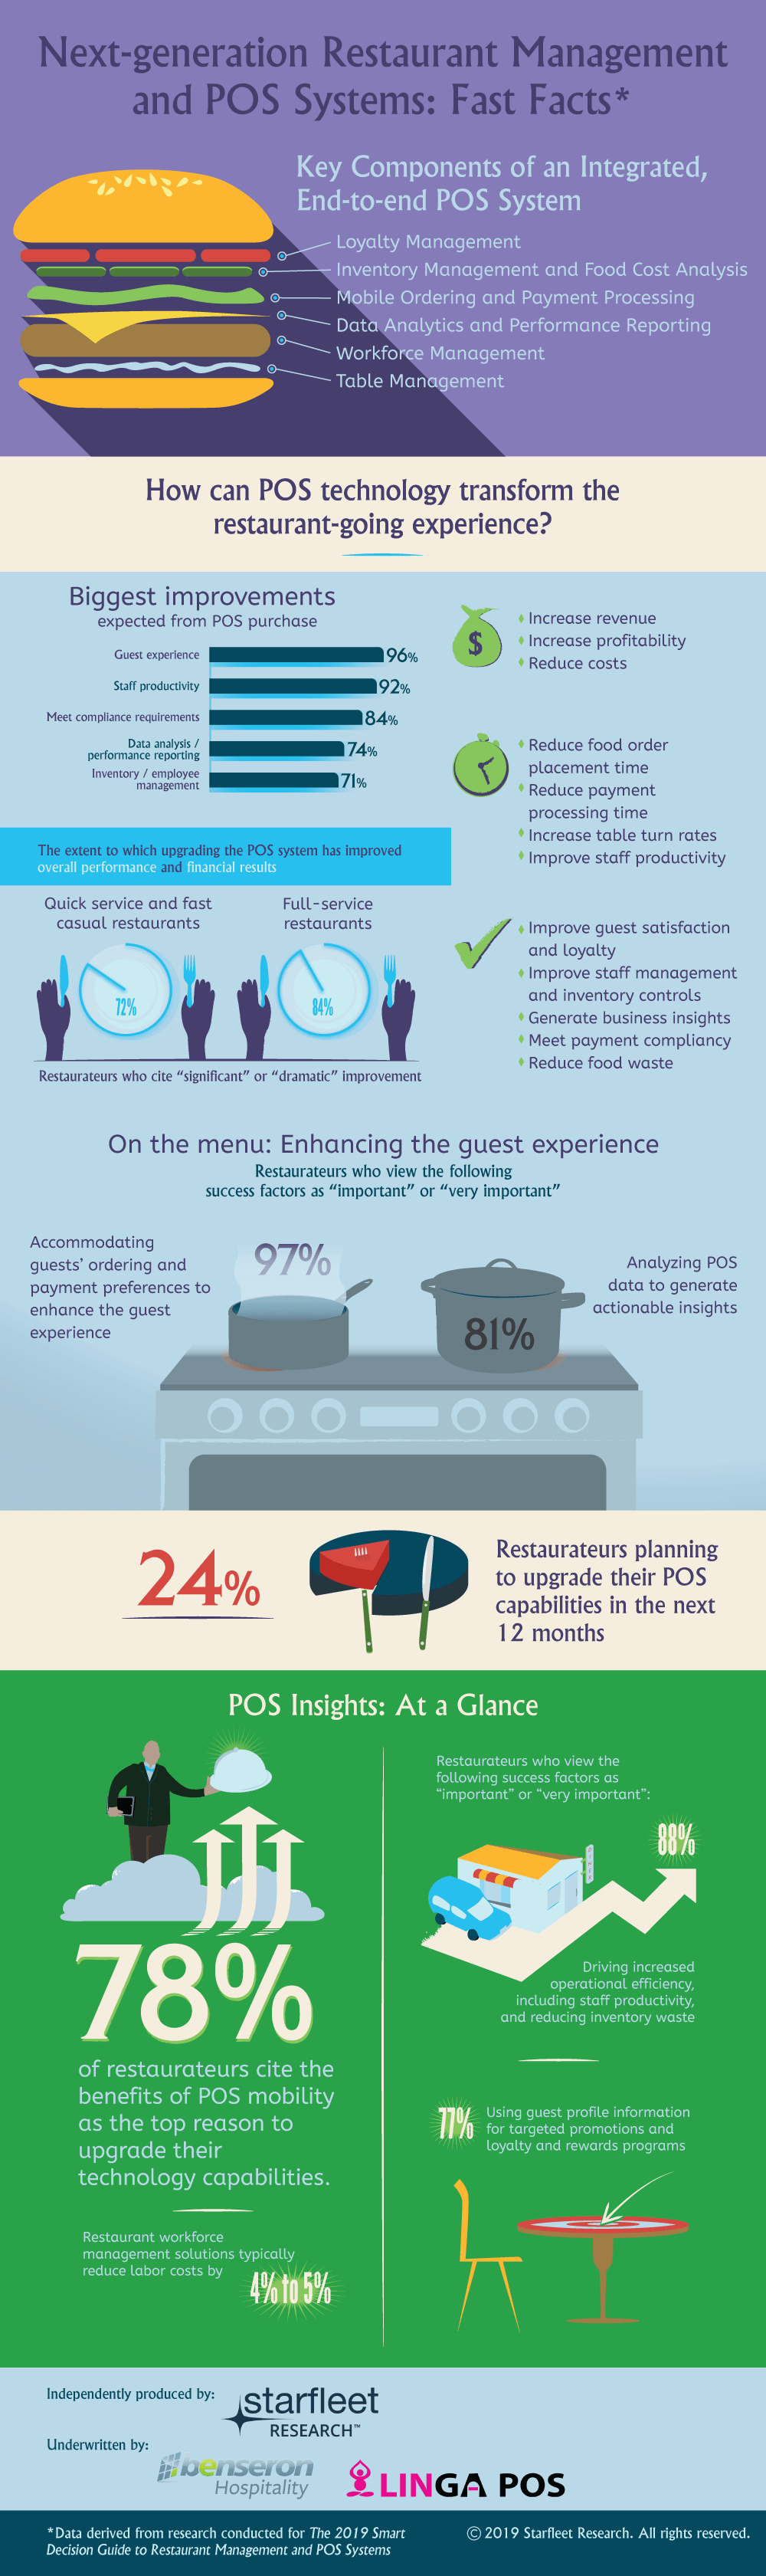
Content assets need to be gated in order to generate leads, but not to be valuable. A good example is an infographic, which, simply put, is the visual display of quantitative information (hardly a new concept, as the noted historian Edward Tufte has long observed), usually in the form of 1-page PDF that, in some instances, can seem to stretch on for miles. According to a benchmark study we conducted a few years back, infographics are rarely gated, but, nonetheless, are rated valuable by 92 percent of marketers given their ability to drive website traffic and create brand awareness. According to new research, infographics receive three times more likes and shares on social platforms, on average, compared to other types of content assets, driving increased traffic to a company website or landing page. Let’s face it: Infographics have the power to transform dull data into captivating imagery. As hard as we try to keep our readers on the edges of their seats, we know that reading a 40-page Smart Decision Guide or other eBook or market research report rich in information and data can require a significant amount of time and attention. Turning some of the key takeaways into an infographic streamlines the process and make a lasting impression on the target audience of technology decision makers. At Starfleet Media, we’re often busy producing co-branded infographics that leverage the latest research from Starfleet Research, our IT market research arm, on behalf of our clients. The following is a new example of a co-branded infographic, on restaurant management and POS systems.